n

During the week, I assign a discussion topic for after lunch with the lofty goal of trying to solve or at least examine some of the wine industry’s biggest issues. Tuesday’s topic is about the use of the 100 point scale in wine. I split the class into two groups and assign one group the task of coming up with everything good about using numerical scores for wine. The other group’s assignment is come with everything wrong about it. Here’s a sampling of answers from hundreds of students and dozens of classes over the last decade (Remember, these are student answers and not mine).
100 Point Scale – Pros:
·Helps wineries sell wine.
·Helps PR and marketing people sell wine.
·Shelf-talkers in retail shops that use scores help sell wine and make it easier for consumers to find quality wines.
·Helps collectors buy futures.
·Provides an impetus for winemakers and wineries to make better wines, i.e., better wines theoretically should get better scores.
·Provides an easy-to-understand system for consumers to understand.
·Creates a level playing field for comparing wine quality.
·Creates instantaneous markets for regions, appellations and wineries that were previously non-existent (Priorat a perfect example).
100 Point Scale – Cons:
· The entire scale is not used—scores practically always fall between 70-92 points.
·A score reflects the opinion of either a single taster or is an average of several different tasters.
·Scores presuppose we all like the same style of wine.
·Wines with high scores tend to be riper styles with higher alcohol and more use of new oak. Delicate wines don’t get high scores as often.
·All grape varieties are not created equal; certain grapes/wines such as Sauvignon Blanc rarely get high scores like Cabernet Sauvignon.
·Winemakers have consciously have adjusted their winemaking to produce riper, richer wines to get higher scores. As a result, winemaking and wine styles are becoming homogenized.
·Wine is a living, ever-changing thing; how can a score based on a single tasting experience accurately reflect a wine?
·There is such a thing as a perfect 100 point wine.
·What’s the difference between wines rated at 89 and 90 points?
·Scores presuppose a precision in wine that does not exist.
·Scores don’t take context into account—how the wine will ultimately be enjoyed. Will a given wine be consumed with food? By itself?
The last point is always my favorite. While I certainly get the use of scores as an attempt to convey a wine’s quality, they don’t take context into account. Last year I wrote a post on context and wine called “The Beautiful Imprecision of Wine” (http://www.timgaiser.com/1/post/2012/6/the-beautiful-imprecision-of-wine.html). I put forth that there are three variables in any wine experience: the wine, the taster and the context. I argued that the context was by far the most important variable because it took into account everything from the time of day the wine was tasted, the glassware, the wine temperature, the temperature of the tasting room, how many wines were being tasted, the order of the wines in the tasting and much, much more. Change any one of these variables and you change a taster’s experience of a given wine.
In case you’re wondering, the first group of students always does a good job coming up with the benefits of using the 100 point system. However, when we get to the cons everyone inevitably piles on and it’s usually not pretty. After hashing it out for the better part of an hour, I ask the students to do one last thing; come up with a system that can convey the most important aspects of a well-made wine to a consumer without using any kind of numerical score, be it a 20 points, 100 points, or whatever.
After much deep thinking and serious discussion, every class comes up with a strikingly similar system using the most vital components of wine such as sweetness/dryness, intensity of flavor, acidity, tannin, and the use of oak. From there, the students take each component and set extremes as baselines, as in a little of something versus a lot. For example, with sweetness or dryness they list “bone dry” at one end with “dessert” at the other; for intensity of flavor they usually list “delicate” and “intense.” And so on. Then the extremes for each component are filled in either by using low, medium, high, and variations thereof or with numbers in increments of three, seven, or nine (Remember, no base ten!). The results look something like this:
Intensity of flavor: Delicate 1 2 3 4 5 6 7 Intense
Sweetness/dryness: Bone dry 1 2 3 4 5 6 7 Dessert
Body: Light-bodied: 1 2 3 4 5 6 7 Full-bodied
Acid: Light acidity 1 2 3 4 5 6 7 Tart acidity
Tannin: No tannin 1 2 3 4 5 6 7 Astringent
Oak: No oak 1 2 3 4 5 6 7 100% new oak
At this point the students all sit back feeling pretty good. After all, they’ve just come up with a fairly creative system that manages to convey a great deal about a wine without using a numerical representative. I end the session by giving them the bad news: their brilliant system was created and used quite some time ago.
In the summer of 1994, dear friend and fellow Master Peter Granoff opened the cyber doors to Virtual Vineyards, not only the first online wine retail “shop” but also the very first online retailer of any kind. Peter and his brother-in-law Robert Olson started Virtual Vineyards on a server literally in Olson’s garage. To avoid using numerical scores, Peter devised a system almost exactly like the one above to convey the most important information about every wine in the VV portfolio. His system used intensity of flavor, body, sweetness/dryness, acidity, tannin, oak, and complexity represented in one-through-seven increments.
As with so many other online ventures of the time, Virtual Vineyards grew slowly at first. I was the 13th employee joining the company in April of 1996. Then with the help (or curse depending on how you look at it) of tens of millions of dollars of VC funding, Virtual Vineyards grew dramatically becoming the original version of wine.com before acquiring a competitor in mid-2000 and ultimately being unplugged by VC’s in April of 2001. I will say no more. But aside from being remarkably ahead of its time—there is nothing like it even today—Virtual Vineyards managed to sell over $50 million of wine in five years using Peter’s system and without ever using a single numerical score.
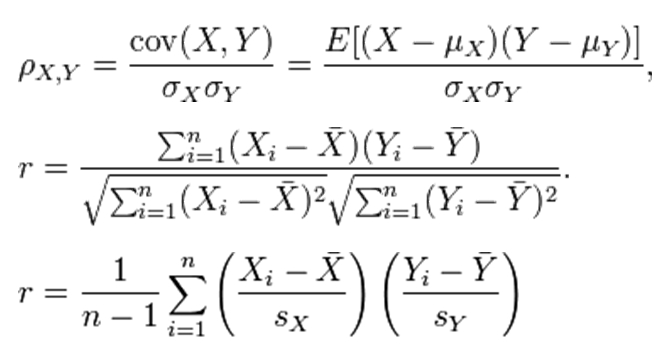
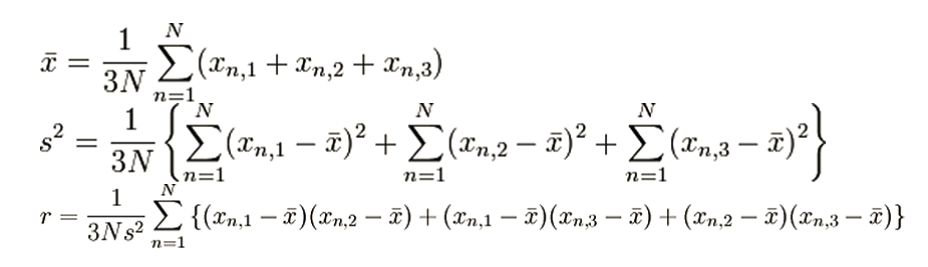
Several days before our departure our contact in Istanbul e-mailed the tasting schedule, information about hotels and the tasting venue, as well as the news that we would be scoring the wines on a 100 point scale. Further, our contact would be tracking and calculating the validity of our scores by using the Pearson Correlation Coefficient for every 10th wine tasted. I’ve included it below for your curiosity and enjoyment (Sorry that the scan is a bit muddled).
nn